For this graph tells me how many people prefered scary,low-key,suspenseful types of music. 44% of the people voted scary and that was the highest and 0% voted other which was the lowest. from this graph i can tell that most people prefere scary films. in this graph i can also see that they adudience are not a big fan of low-key or suspensful films as they are less interested in those types of films.
For this graph i can see that 24% of the people that voted, voted for insidious., this showed that they liked all the films that were given as an option and this guaranteed that the audience/public like the options that we gave them, we can also see that 8% of the people said other which means that the
8% of them like other films, not the ones that were given to them
For this graph we can see that a lot of people want to include social media in their thriller film because they know that it will attract a lot of people as social media is one of the most popular things that people use. we can also see that 40% of peeople of our target audience would be highly interested in this type of element.
For this graph we can see the ratio between our target audience and who will be interested in our upcoming thriller and with this bit of information we can see that 28% of people of our target audience would be interested in this type of place for the thriller film to be set in, as it is a quiet and beautiful place.
For this graph we have asked the audience if they like thriller films or not and from the results we found out that 80% of people of our target audience said yes, that they like thriller films whereas 20% of people of our audience said that they do not like thriller films.
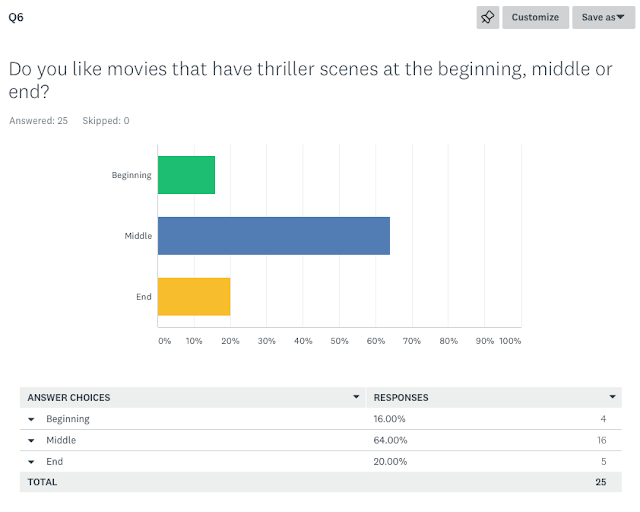
For this graph we have asked the audience if they like to have thriller scenes at the beginning,middle or end of films and from the results we can see that 64% of people of our target audience said that they prefer thriller scenes in the middle of the film and 16% said they like it at the beginning and 20% said that they like it at the end, personally i would say that i like the thriller scenes at the end.
For this graph we asked the audience to tell us, what type of lighting they would prefer in a film, from the results that we have recived i can say that 44% of people of our target audience said that they prefer dull lighting as it will add more suspense into the film. dull lighting was voted for the most whereas high- key lighting was voted for the lowest with 12% of people of our audience.
For this graph we asked the audience to tell us what type of thriller they would add in their film, from the results given we can see that 36% of the people of our audience said that they prefer revenge in thier film and that was the most popular votes given, on the other hand the lowest type of thriller that the audience would want to add in their film was death.
For this graph we asked the audience to tell us what type of camera shots they prefered in films and from the resulst we can see that most people said that they prefered long shots, which includes a distnace shot from the scene or character. 32% of people of our target audience said that they prefer long shots and 12% said that they prefer over the shoulder shots.
For this graph we asked the audience to tell us what genger the would want the antagonsit to be and most people with 60% said that they prefered a demale to play the role of the antagonist.


No comments:
Post a Comment